The Hudson School Hoboken New Jersey
Dr. Terrell Neuage
Excel Monday 19 April
Part 1
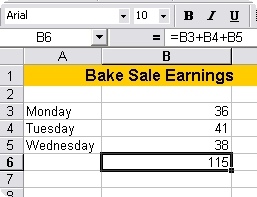
Example - Suppose you wanted to add the total amount of money earned in a bake sale.
The formula =B3+B4+B5 means:
Add:
Functions can be a faster way of doing mathematical operations than formulas.
Example - if you wanted to add the values of cells D1 through D10, you could type the formula "=D1+D2+D3+D4+D5+D6+D7+D8+D9+D10".
A shorter way would be to use the SUM function and simply type "=SUM(D1:D10)".
Two popular functions and examples are given in the table below:
Function |
Example |
Description |
SUM |
=SUM(A1:100) |
finds the sum of cells A1 through A100 |
AVERAGE |
=AVERAGE(B1:B10) |
finds the average of cells B1 through B10 |
Sorting
To sort means to alphabetize.
The Sort Buttons
![]()
To sort data in one column: |
|
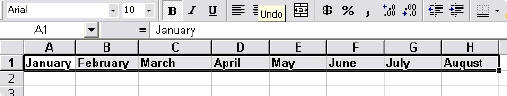
Autofill
The Autofill feature allows you to quickly fill cells with data such as months or numbers, and repeated text.
|
|
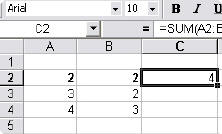
Autofill Functions
Autofill can also be used to copy functions.
In the example, column A and column B each contain lists of numbers and column C contains the sums of columns A and B for each row.
The function in cell C2 would be "=SUM(A2:B2)".
|
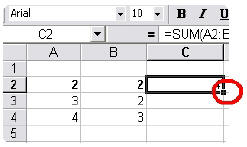
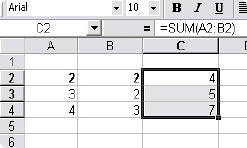
To copy this function:
|
|
Burger King http://www.bk.com/
Wendy's http://www.wendys.com/
McDonalds http://mobile.mcstate.com/nutrition/
Chick fil A http://www.chick-fil-a.com/#nutritiondata
See also http://www.nutritiondata.com/
How Healthy Are Your Fries? - Do a comparison of the calorie, fat and sodium content of fries for each fast food company.
Large Burgers – Do a comparison chart of the calorie, fat, sodium, and protein content of the largest burgers for each fast food company.
Shakes - Is there any difference in shakes from one company to another? Make a chart using variables you think will show the greatest differences from company to company.
Pretend you work for one of the fast food companies. Using the data for small burgers, make a chart using any variables that will make your company look more favorable than the others.
Product |
Calories |
Total fat (g) |
Sodium (mg) |
Protein (mg) |
Vanilla Shake |
360 |
9 |
250 |
11 |
Regular Hamburger |
270 |
9 |
600 |
13 |
Big Mac |
570 |
32 |
1100 |
10 |
Fries (small) |
210 |
10 |
135 |
3 |
Product |
Calories |
Total fat (g) |
Sodium (mg) |
Protein (mg) |
Vanilla Shake |
330 |
6 |
260 |
9 |
Regular Hamburger |
320 |
15 |
520 |
19 |
Whopper |
660 |
40 |
940 |
29 |
Fries (small) |
230 |
11 |
630 |
3 |
Product |
Calories |
Total fat (g) |
Sodium (mg) |
Protein (mg) |
Frosty |
330 |
8 |
200 |
4 |
Regular Hamburger |
270 |
10 |
610 |
15 |
Big Bacon Classic |
580 |
30 |
1460 |
12 |
Fries (small) |
270 |
13 |
85 |
2 |
Product |
Calories |
Total fat (g) |
Sodium (mg) |
Protein (mg) |
Vanilla Shake |
230 |
7 |
150 |
8 |
Regular Hamburger |
135 |
7 |
135 |
6 |
Double Cheeseburger |
285 |
18 |
430 |
14 |
Fries (small) |
116 |
6 |
15 |
0 |
Use Excel and the data below to make graphs of the following :
|
|||